
AREAS OF KNOWLEDGE:
THE HUMAN SCIENCES
BEGUILING WITH STATISTICS
“There are three kinds of lies: lies, damned lies, and statistics.”
This, at times, light-hearted class activity is a thinly disguised, critical approach to the use of statistics in the Natural and Human Sciences. Robust scientific studies are mostly rooted in numerical data expressed in graphical form. Credible results are often reinforced by the use statistical techniques such as: mean, mode and median; binomial distribution; standard deviation; the convention of requiring 95% a confidence rate (pく 0.05) to reject a null hypothesis; and more specialized tools like Chi-square and Hardy-Weinberg beloved by HL Biology students!
Statistical literacy is not just about the appropriate use of statistical tools it is also about a critical approach to the methodology behind obtaining specific data, and how complex multiple variables play into interpreting the data.
Here are two overarching Knowledge Questions from the TOK Subject Guide that will be addressed today:
How are unethical practices, such as “data dredging,” used by statisticians to deliberately manipulate and mislead people?
What steps can we take to help ourselves avoid being misled by statistics used in unclear or disingenuous ways in the media?
CLASS ACTIVITY — BREAKFAST

Begin with this fun, warm up activity. Inform the class that we will be investigating the following hypothesis:
The breakfast of choice in this TOK class is some kind of cooked carbohydrate.
The teacher will systematically call on each member of the class in sequence to write what they had for breakfast this morning.
For extreme theatricality, stop the activity abruptly, after obtaining only the very first data point! Based only on that: boldly reject or confirm the hypothesis!
After quelling any uproar. Concede the comic absurdity of this approach and continue collecting the data for the entire class. When complete leave the entire set of results visible without further comment. We will return to this gustatory investigation later.
CORRELATION VS. CAUSATION
Next, show this down-to earth TEDx talk about the perils of mixing up causality and causation.
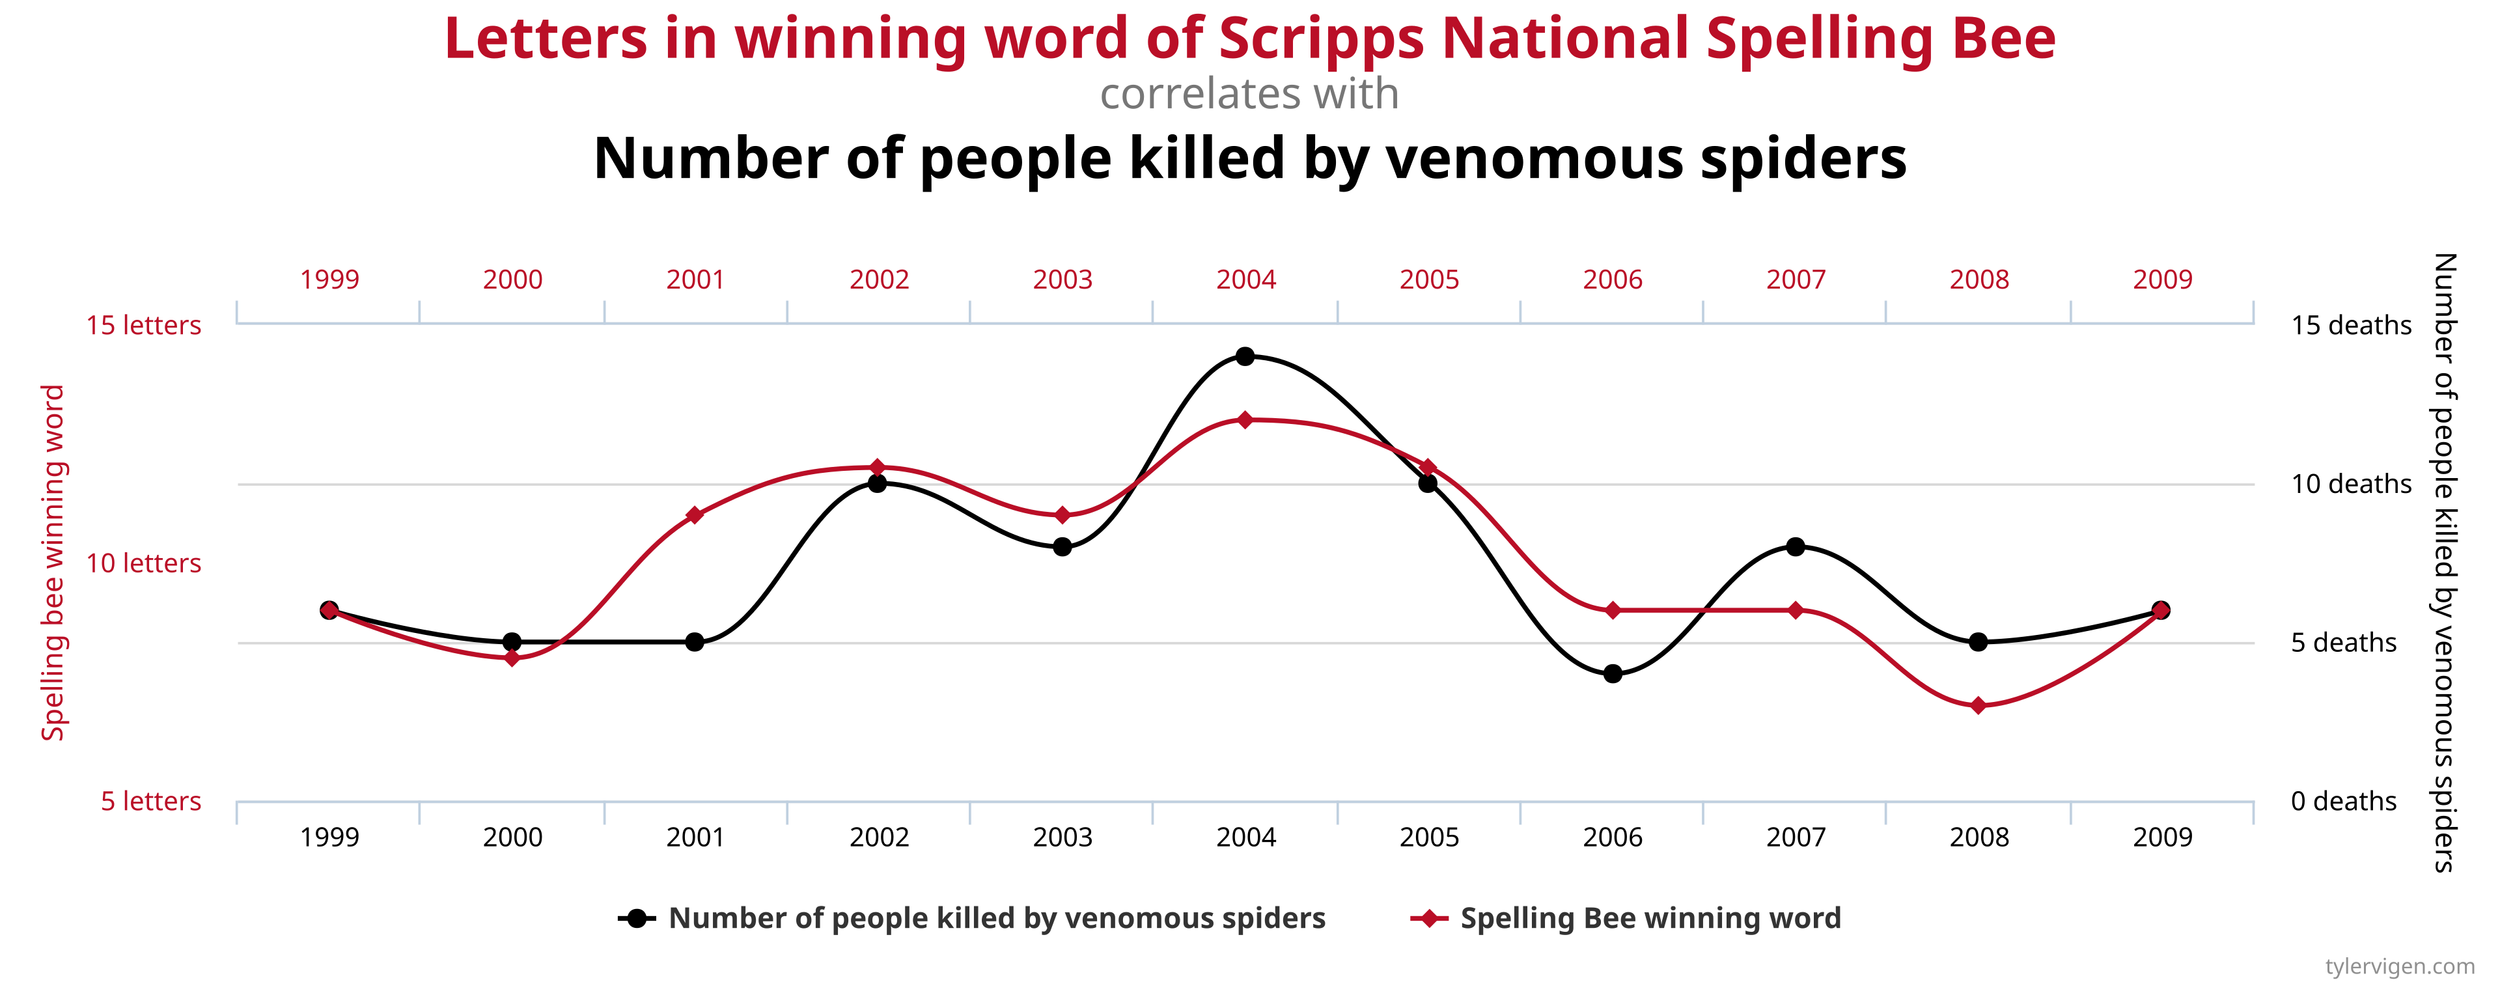
Apparent correlation between the number of letters in Scripps National Spelling Bee's winning word and the number of people in the United States killed by poisonous spiders!
WHAT IS data dredging?
P-hacking is the formal name for data dredging—an unethical approach to analysis that selects data patterns that appear statistically significant when they are really not. Behind the curtain, only favorable results are selected and formally reported.
Refer back to the carbohydrate breakfast class data set. Ask the class how could we very crudely “cherry pick” the data to support the following hypotheses:
The breakfast of choice in this TOK class is a bowl of cereal with milk.
Most students in this TOK class do not eat breakfast.
The breakfast of choice in this TOK class is some kind of cooked carbohydrate.
preregistration and replicability
Replicability is an important facet of trustworthy science. Can another research group obtain the same results by repeating the study using the similar methods? P-hacking sabotages meaningful replicability.
The best way of eliminating p-hacking in the first place is to “preregister” the methodology of a study and stubbornly sticking with it; including safeguarding all results. In our light-hearted breakfast study the pregistered methodology should have been:
Call on each member of the class in sequence to write on the whiteboard what they had for breakfast this morning, keeping the entire set of results.
This would preclude stopping the study prematurely or otherwise cherry picking results to contrive silly conclusions!
pく0.05 AND THE NULL HYPOTHESIS
In scientific studies there is a convention that results are deemed significant when it can be shown that there is at least a 95% chance that the results obtained did not happen by chance alone.
The formal way that scientists express this often causes confusion because it involves grappling with a double negative—the rejection of the, so-called, null hypothesis.
The null hypothesis is the assumption that the effect being studied simply does not exist—it is a worthless fantasy! The standard tipping point for a robust study is a probability value of pく0.05. This means that there is a less than 5% chance that the null hypothesis is true; therefore something surprising and interesting must be happening.
CONCLUSION
End this beguiling with statistics unit by sharing this summative video and inviting students to make connections with our infamous breakfast study.
After the video, remind students that rejecting the null hypothesis remains purely in the theoretical statistical realm. It can tell us that something of interest is going on, but it says nothing at all about what that something actually is. We must use our scientific judgement about the rigor and context of how results were obtained, as well as pinpointing correlation and cause and effect!
End by asking students:
Did you learn anything new today?
Do you feel a notch more statistically literate?
How can we avoid being beguiled by statistics used in unclear or disingenuous ways in the media?
“Der Tod eines Menschen: das ist eine Katastrophe. Hunderttausend Tote: das ist eine Statistik!
The death of one man: that is a catastrophe. One hundred thousand deaths: that is a statistic!
”